Assessment / Summer 2012 > AC 131/1 - ACCOUNTING 1, Section 1
PRETEST
These assessment data are for AC 131/1 - ACCOUNTING
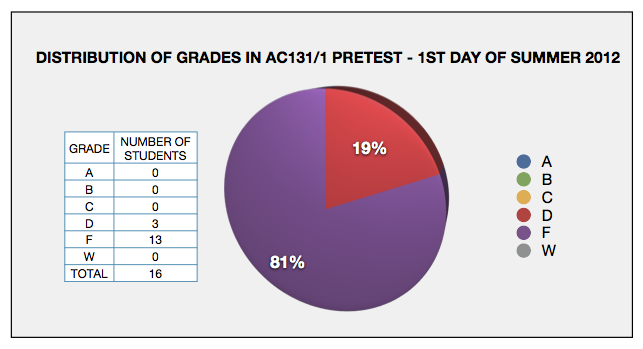
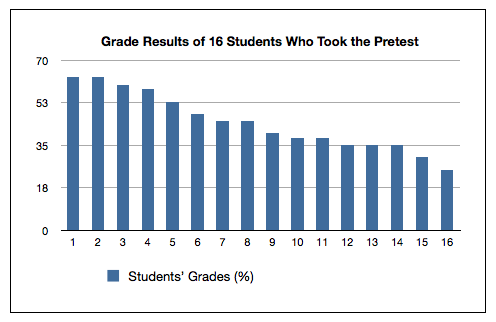
1, Section 1 in Summer 2012. Sixteen (16)
students took
the pretest on the first day of class. Three (3) students, or
19% of the total, got a grade of D, and the rest, or 81%, failed the
test. None got A, B, or C. Compare these results (see chart)
with the distribution of grades of students at the end of the first week of instruction.
The highest grade in the pretest was 63% (Students 1 and 2), while the lowest was 25% (Student 16). The average for the class was 44%.
Pretest questions were embedded in the final exam which also served as a posttest. Towards the end of the term, three students had already withdrawn from the course and one stopped showing up in class several consecutive meetings before the finals, hence only 14 of those who originally took the prestest actually took the posttest.
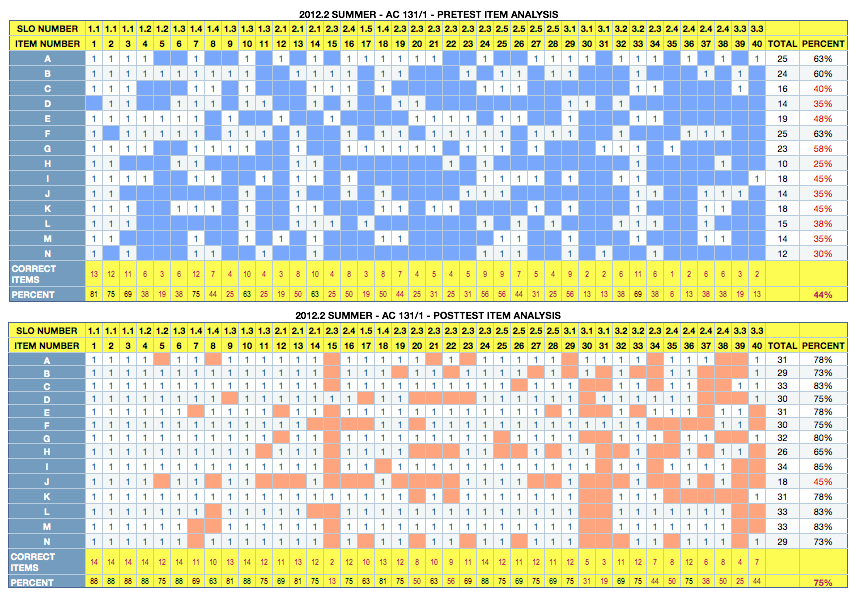
The two colored tables below that look like crossword puzzles present an item analysis of both tests. The cells with number 1 represent items answered correctly by the students, who in turn are designated by letters A to N on the left column. Cells filled with blue (pretest) and orange (posttest) represent items answered incorrectly. As expected, there were more incorrect than correct answers in the pretest while the opposite is true in the posttest. There were 40 items in all, each item equivalent to one assessment question, with corresponding SLO indicated at the top row of the tables.
Percentage results shown in the last columns indicate that, from an average grade of 44% in the prestest to 75% in the posttest, there is clear evidence that most intended learning outcomes were successfully achieved and that learning had taken place.
PERFORMANCE INDICATORS – FIRST WEEK OF SUMMER
ATTENDANCE – Although students do not get credits for outstanding performance in this criteria, attendance is an important indicator because of its high correlation to how the students perform in other areas, like class works and quizzes. Students who often miss classes generally perform poorly in class, although the oppossite doesn't necessarily mean true in all cases.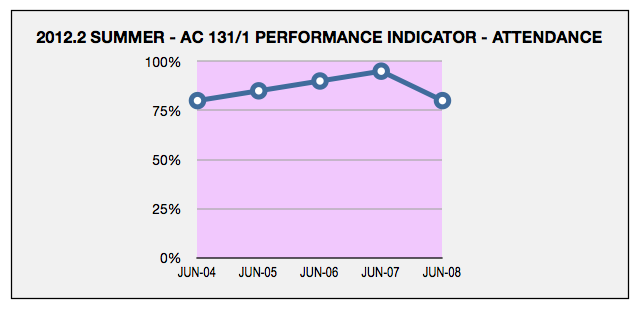
By end of the first week of Summer 2012, one (1) student didn't show up since Day 1 and had, therefore, accumulated five (5) consecutive absences. In accordance with attendance policy, this student was automatically withdrawn from the class. The highest attendance was recorded in June 7 (95%) with only one student absent, the lowest, 80%, was in June 4 (Monday) and 8 (Friday.) Overall, the attendance average for the entire first week was 86%.
SEE WEEKLY UPDATES:
- ATTENDANCE FOR WEEKS 1 & 2 (JUNE 4 TO 15)
- ATTENDANCE FOR WEEKS 1, 2, & 3 (JUNE 4 TO 21)
- ATTENDANCE FOR WEEKS 1, 2, 3, & 4 (JUNE 4 - 29)
- ATTENDANCE FOR WEEKS 1, 2, 3, 4, & 5 (JUNE 4 - JULY 6)
- ATTENDANCE FOR WEEKS 1, 2, 3, 4, 5 & 6 (JUNE 4- JULY 13)
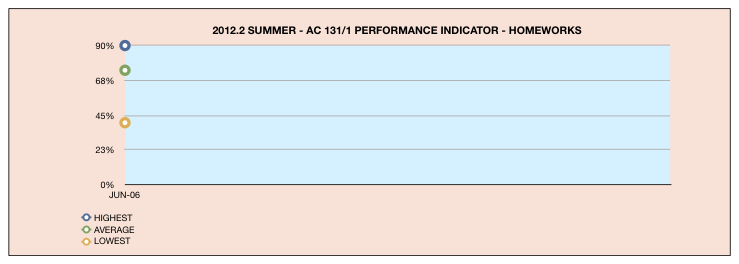
HOMEWORK – There was only one homework in the first week. The highest individual grade was 90%, while the lowest was 40%; the average for the whole class was 74%.
SEE WEEKLY UPDATES:
- HOMEWORK FOR WEEKS 1 & 2 (JUNE 4 TO 15)
- HOMEWORK FOR WEEKS 1, 2, & 3 (JUNE 4 TO 21)
- HOMEWORK FOR WEEKS 1, 2, 3, & 4 (JUNE 4 - 29)
- HOMEWORK FOR WEEKS 1, 2, 3, 4, & 5 (JUNE 4 - JULY 6)
- HOMEWORK FOR WEEKS 1, 2, 3, 4, 5 & 6 (JUNE 4- JULY 13)
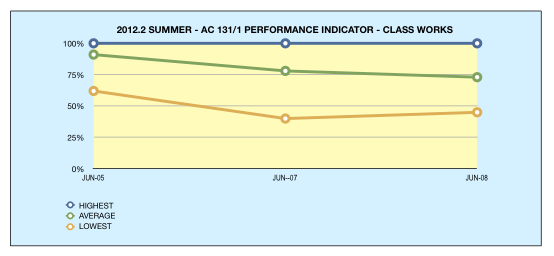
CLASS WORK – All class works in this class involved problem solving, and three were given during the first week. In all three instances the highest individual grade was 100%. However, the lowest individual grades were 62%, 40%, and 45%. The class averages were 91%, 78%, and 73%.
SEE WEEKLY UPDATES:
- CLASS WORKS FOR WEEKS 1 & 2 (JUNE 4 TO 15)
- CLASS WORKS FOR WEEKS 1, 2, & 3 (JUNE 4 TO 21)
- CLASS WORKS FOR WEEKS 1, 2, 3, & 4 (JUNE 4 - 29)
- CLASS WORKS FOR WEEKS 1, 2, 3, 4, & 5 (JUNE 4 - JULY 6)
- CLASS WORKS FOR WEEKS 1, 2, 3, 4, 5 & 6 (JUNE 4- JULY 13)
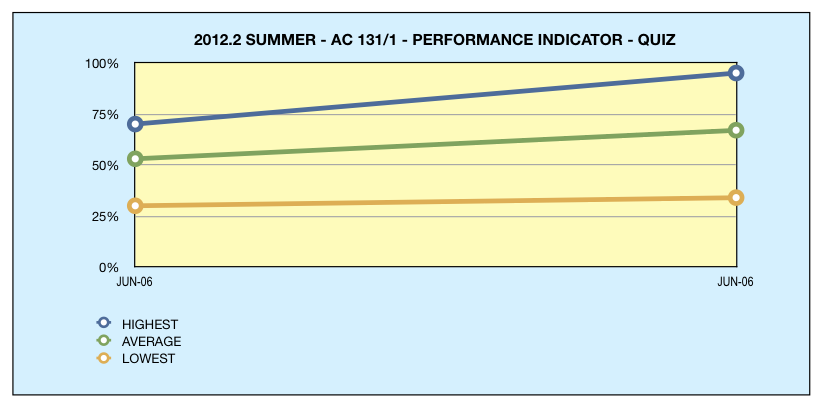
QUIZ – Two quizzes were given during the first week, both on the same chapter. One quiz covered accounting theories, and the other, problem solving. The students did better in problem solving than in theory test, in which the highest individual grade was 70% and the lowest was 30%. Out of 18 students who took the quiz, only two (or 11%) got C which, as mentioned, is also the highest. The rest got D or F. For the problem solving quiz, the highest individual grade was 95%, the lowest 34%, and the average for the whole class, 67%. Half (or 50%) of the class got grades of C or higher in problem solving.
SEE WEEKLY UPDATES:
- QUIZ FOR WEEKS 1 & 2 (JUNE 4 TO 15)
- QUIZ FOR WEEKS 1, 2, & 3 (JUNE 4 TO 21)
- QUIZ FOR WEEKS 1, 2, 3, & 4 (JUNE 4 - 29)
- QUIZ FOR WEEKS 1, 2, 3, 4, & 5 (JUNE 4 - JULY 6)
- QUIZ FOR WEEKS 1, 2, 3, 4, 5 & 6 (JUNE 4- JULY 13)
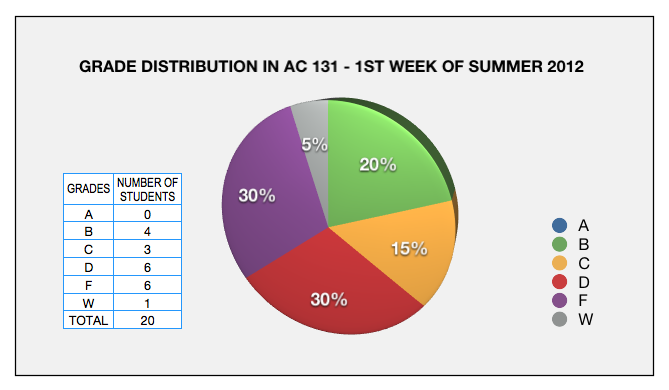
GRADE DISTRIBUTION – Homeworks, class works, and quizzes have weights of 20% each. At the end of the first week of Summer 2012, only 35% got grades of C or higher. The remaining 65% either withdrew (5%), failed (30%), or passed with a grade of D (30%). Compare these first-week results with the Pretest results shown earlier.
SEE WEEKLY UPDATES:
- GRADE DISTRIBUTION – END OF 2ND WEEK (JUNE 15)
- GRADE DISTRIBUTION – END OF 3RD WEEK (JUNE 21)
- GRADE DISTRIBUTION – END OF 4TH WEEK (JUNE 29)
- GRADE DISTRIBUTION – END OF 5TH WEEK (JULY 6)
- GRADE DISTRIBUTION – END OF 6TH WEEK (JULY 13)
- GRADE DISTRIBUTION – END OF SUMMER 2012 (JULY 19)
SPECIFIC LEARNING OUTCOMES
The topics covered and the specific student learning outcomes (SLOs)
assessed are listed below.
| TEST COVERAGE AND SLO'S ASSESSED | |||||||
TEST COVERAGE There were 40 questions in the pretest. These questions, all in multiple choice format, were linked to the following student learning outcomes (SLOs).
The pretest assessed only the theoretical dimensions of selected student learning outcomes. SLOs not covered in the pretest were assessed using homeworks, class works, and quizzes that involve solving accounting problems. |
|||||||
SEE ALSO:
