Assessment / Summer 2011 > AC 131/1 - ACCOUNTING 1
WEEKLY ASSESSMENT DATA
Some SLOs were assessed using pretest-posstest; other SLOs, by means of classroom and home activities
(quizzes, class works, exams, and home assignments). Summaries
–
or hightlights – of results are shown below on a week-by-week
tabular and/or chart presentation.
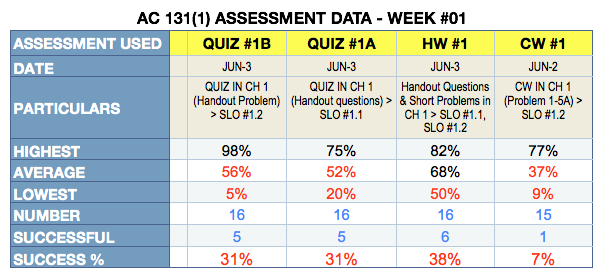
WEEK #01 (JUNE 1-3, 2011) - A pretest was given on the first day. After the add/drop period, the final list of registered students went from 20 down to 17. The varying number of students who turned in homeworks, class works and quizzes indicated that one or more students were either absent or failed to turn in a requirement, or both. Success Rate (%) was calculated as follows: successful students ÷ number of students. Thus, for CW #1 on June 2, it was 1 ÷ 15, or 7%. As used herein, 'Successful' and 'Success Rate' were defined as number and percentage of students present (or absent but with Homework turned in when due) who earned grades of C or higher in the SLOs assessed.
The first couple of weeks are normally a period of adjustment especially for new students, or at least students attending classes for the first time under this instructor. Thus, from the relatively low average ratings for the whole class during the first week of instruction, it may be safely inferred that some students were still adjusting to the instructor's teaching style and his strict policies, the nature and requirements of the course, the significant volume of information to be processed daily, and other factors. This were expected. From a low success rate of 7% to 38%, a better level of student performance is anticipated (or hoped for) in the weeks to come.
At week's end, two students were deemed successful. The remaining 15 needed improvement.
| GRADE DISTRIBUTION AFTER WEEK #01 | ||||||
| A | B | C | D | F | W | TOTAL |
| 0 | 1 | 1 | 4 | 11 | 0 | 17 |
WEEK #02 (JUNE 6-10, 2011)
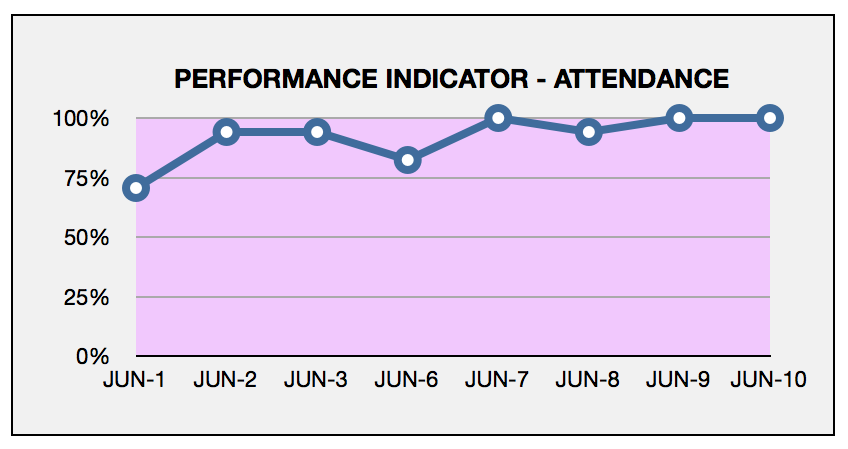
ATTENDANCE. There was a dramatic improvement in attendance in the second week compared to the first week. June 9 and 10 registered perfect attandance.
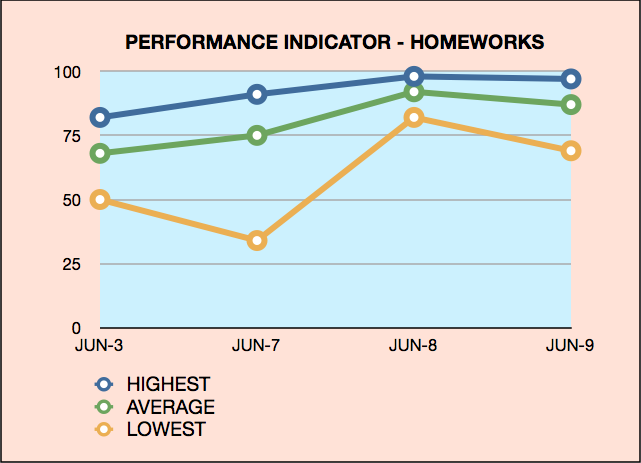
HOMEWORKS - Results showed
positive changes in both highest
individual grades and class averages. Home assignments (HW) tended to
have higher success rates for two reasons: (1) Students who turned in
their works were assured of a minimum of 30% rating for their efforts
(even if their solutions were all wrong), as compared to those who
failed to submit their works who automatically got 0%; (2) Students had
longer time to prepare and greater opportunity to consult with
classmates, compare works, and possibly (though not necessarily) copy
solutions.


CLASS WORKS AND QUIZZES
[CLICK IMAGE OR THIS LINK
TO VIEW
LARGER VERSION]
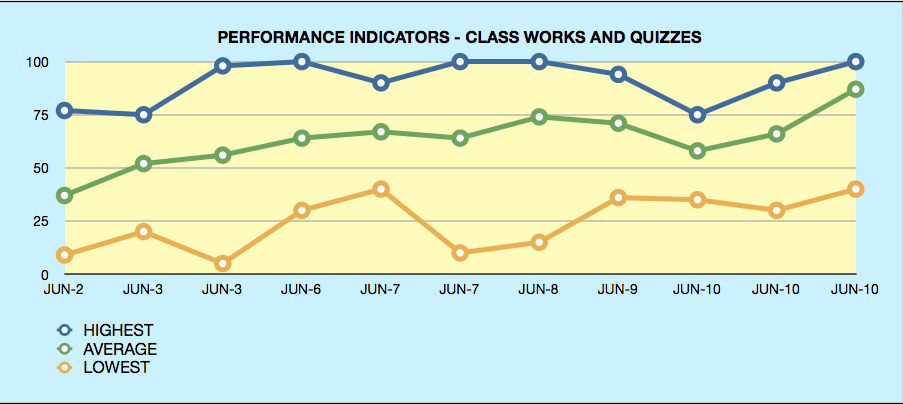
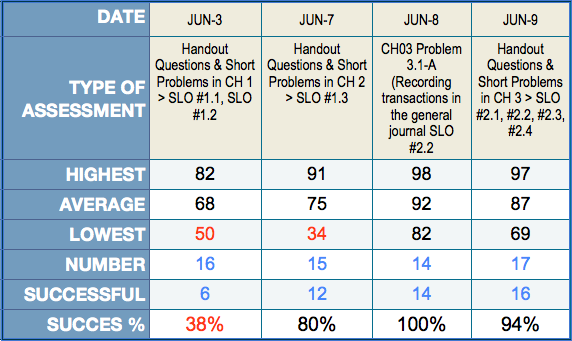
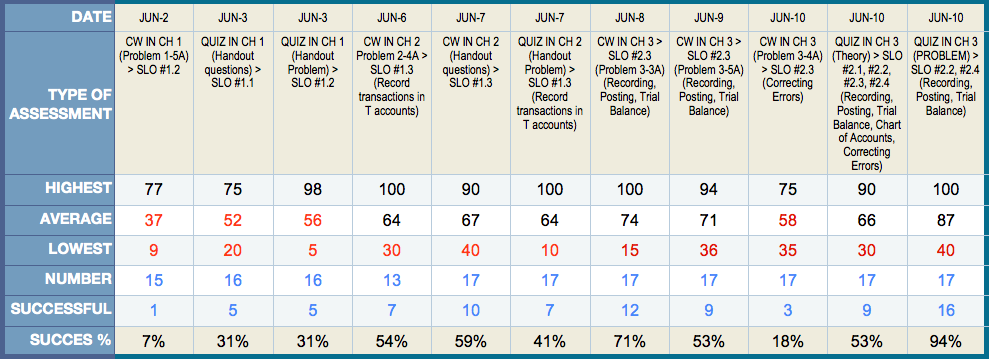
The class averages (green line in the chart above) showed an upward trend, moving closer to the highest (blue) and away from the lowest (orange) grades. This could be an indication that more and more students were past the adjustment and warming up period and were getting more comfortable in dealing with the challenges associated with this course. Still, the very low grades of some students continued to be a major concern.
At the end of the 2nd week, six of the 17 students were deemed successful.
WEEK #03 (JUNE 13-17, 2011)
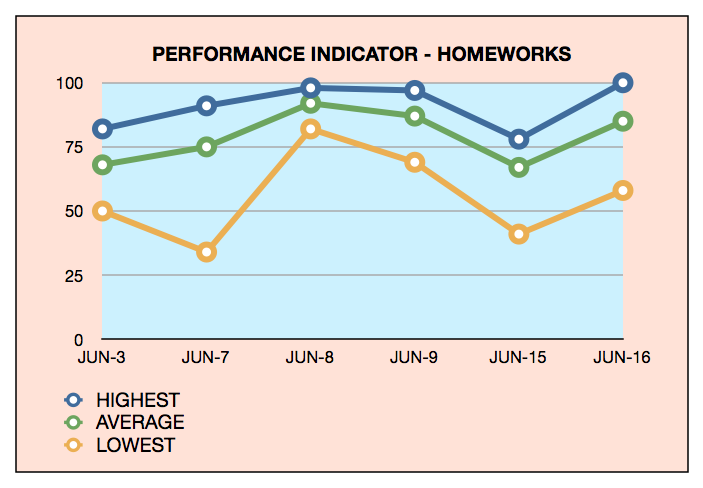
ATTENDANCE continued to show outstanding results (100% for five consecutive days). Class averges for both HOMEWORK, CLASS WORKS & QUIZZES had their ups and downs during the week. The downs represent low grades on the topic of adjusting entries, which many students found more challenging because of the analysis involved. The good news: Averages continued to stick closer to the highest grades.


The third week closed with eight of 17 students considered successful in this course.

The class averages (green line in the chart above) showed an upward trend, moving closer to the highest (blue) and away from the lowest (orange) grades. This could be an indication that more and more students were past the adjustment and warming up period and were getting more comfortable in dealing with the challenges associated with this course. Still, the very low grades of some students continued to be a major concern.
At the end of the 2nd week, six of the 17 students were deemed successful.
| GRADE DISTRIBUTION AFTER WEEK #02 | ||||||
| A | B | C | D | F | W | TOTAL |
| 0 | 5 | 1 | 6 | 5 | 0 | 17 |
WEEK #03 (JUNE 13-17, 2011)
ATTENDANCE continued to show outstanding results (100% for five consecutive days). Class averges for both HOMEWORK, CLASS WORKS & QUIZZES had their ups and downs during the week. The downs represent low grades on the topic of adjusting entries, which many students found more challenging because of the analysis involved. The good news: Averages continued to stick closer to the highest grades.


The third week closed with eight of 17 students considered successful in this course.
| GRADE DISTRIBUTION AFTER WEEK #03 | ||||||
| A | B | C | D | F | W | TOTAL |
| 0 | 4 | 4 | 3 | 6 | 0 | 17 |
WEEK #04 (JUNE 20-24, 2011)
THE CLASS continued to have perfect ATTENDANCE for the whole week. There was only one HOMEWORK during this period, and the grades took a dive. There were five CLASS WORKS and QUIZZES this week, and significant improvements were noted in both the lowest and average grade trends, compared to the previous weeks.

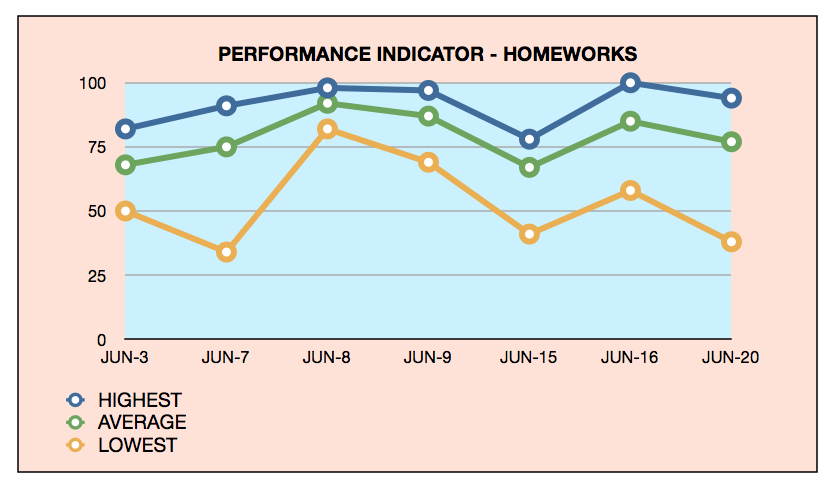

By the end of the fourth week, eight students were deemed successful. One student, upon this instructor's advice, withdrew from the course.
| GRADE DISTRIBUTION AFTER WEEK #04 | ||||||
| A | B | C | D | F | W | TOTAL |
| 1 | 3 | 4 | 6 | 2 | 1 | 17 |
WEEK #05 (JUNE 27-JULY 1, 2011)
ATTENDANCE percentage remained high, with only one absence during the entire week. Again there was only one HOMEWORK during this period, and this time the individual highest grade went down along with the class average, but the lowest grade went up. CLASS WORKS and QUIZZES showed mixed results, with the lowest individual grade plunging down to 29%, and then further down to 23%. This was a disturbing situation, prompting this instructor to discuss the results with the class as well as invite the individuals concerned to the office for consultation.

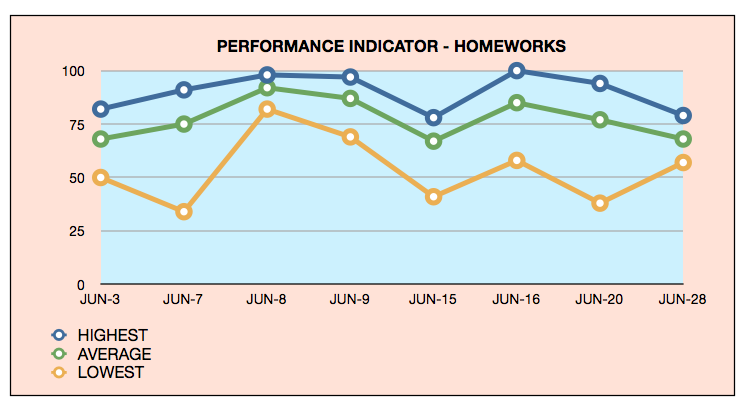

By the end of the fifth week, nine of the remaining 16 students were deemed successful.
| GRADE DISTRIBUTION AFTER WEEK #05 | ||||||
| A | B | C | D | F | W | TOTAL |
| 1 | 2 | 6 | 5 | 2 | 1 | 17 |
With only two weeks remaining and about 40% of the overall grades remaining before the finals, how are the students doing so far?
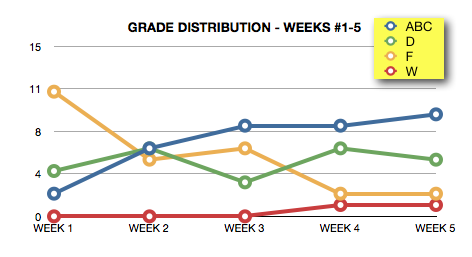
Here, again, are the grade distributions for Weeks #1-5:
| GRADE DISTRIBUTIONS WEEKS #1 TO 5 | ||||||
| WEEK | A | B | C | D | F | W |
| 1 | 0 | 1 | 1 | 4 | 11 | 0 |
| 2 | 0 | 5 | 1 | 6 | 5 | 0 |
| 3 | 0 | 4 | 4 | 3 | 6 | 0 |
| 4 | 1 | 3 | 4 | 6 | 2 | 1 |
| 5 | 1 | 2 | 6 | 5 | 2 | 1 |
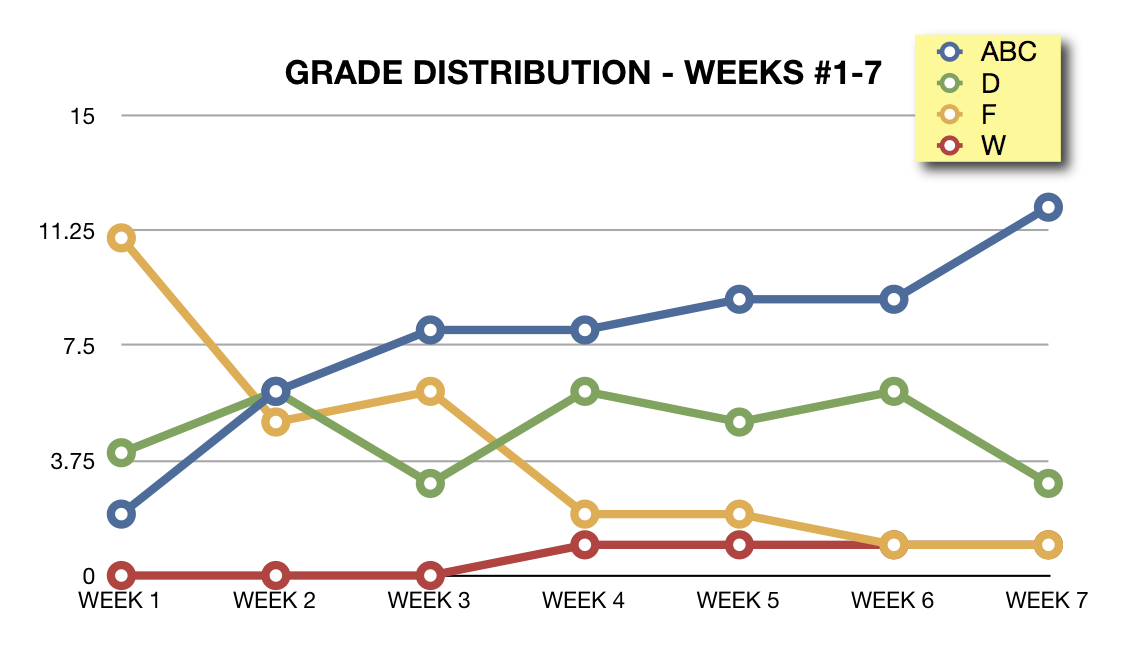
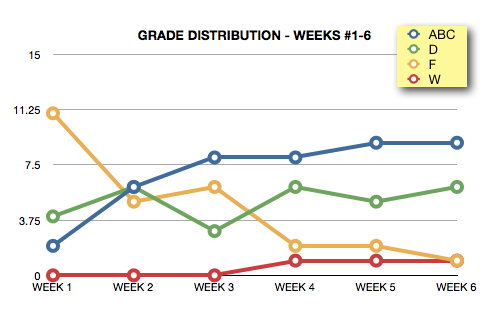
The blue line in the grade distribution chart for the first five weeks (below) represents the number of students who are deemed successful, i.e., those who have grades of C or higher, in this course. From two students in the first week, the numbers grew to nine by the end of the fifth week. Contrast this with the failing (F) students, represented by the yellow-orange line. From a high 11, they are now down to two. Efforts are being exerted to motivate and move these students at least to the next higher grade, and those with grades of 'D' (green line in the chart), to within the passing range.
WEEK #06 (JULY 4-8, 2011)
ATTENDANCE record showed one absence during the week. HOMEWORK trend indicated an upswing. CLASS WORKS and QUIZZES showed ups and downs. A pattern seemed to emerge: Students did well in practical tests and classroom activities (i.e. problem solving), but generally performed poorly in conceptual tests (i.e., theory quizzes).

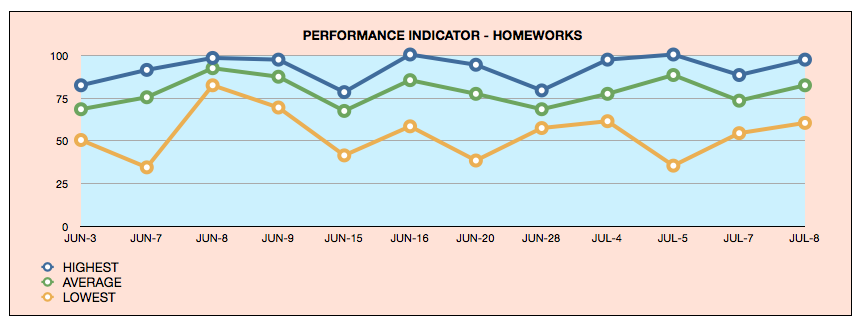

By the end of the fifth week, nine of the remaining 16 students were deemed successful.
| GRADE DISTRIBUTION AFTER WEEK #06 | ||||||
| A | B | C | D | F | W | TOTAL |
| 1 | 3 | 5 | 6 | 1 | 1 | 17 |
With only one week remaining this summer, the grade distributions for six consecutive weeks showed two notable improvements: one "C" student moved to the "B" grade range, and one "F" student migrated over to "D".
| GRADE DISTRIBUTIONS WEEKS #1 TO 6 | ||||||
| WEEK | A | B | C | D | F | W |
| 1 | 0 | 1 | 1 | 4 | 11 | 0 |
| 2 | 0 | 5 | 1 | 6 | 5 | 0 |
| 3 | 0 | 4 | 4 | 3 | 6 | 0 |
| 4 | 1 | 3 | 4 | 6 | 2 | 1 |
| 5 | 1 | 2 | 6 | 5 | 2 | 1 |
| 6 | 1 | 3 | 5 | 6 | 1 | 1 |
WEEK #07 (JULY 11-14, 2011)
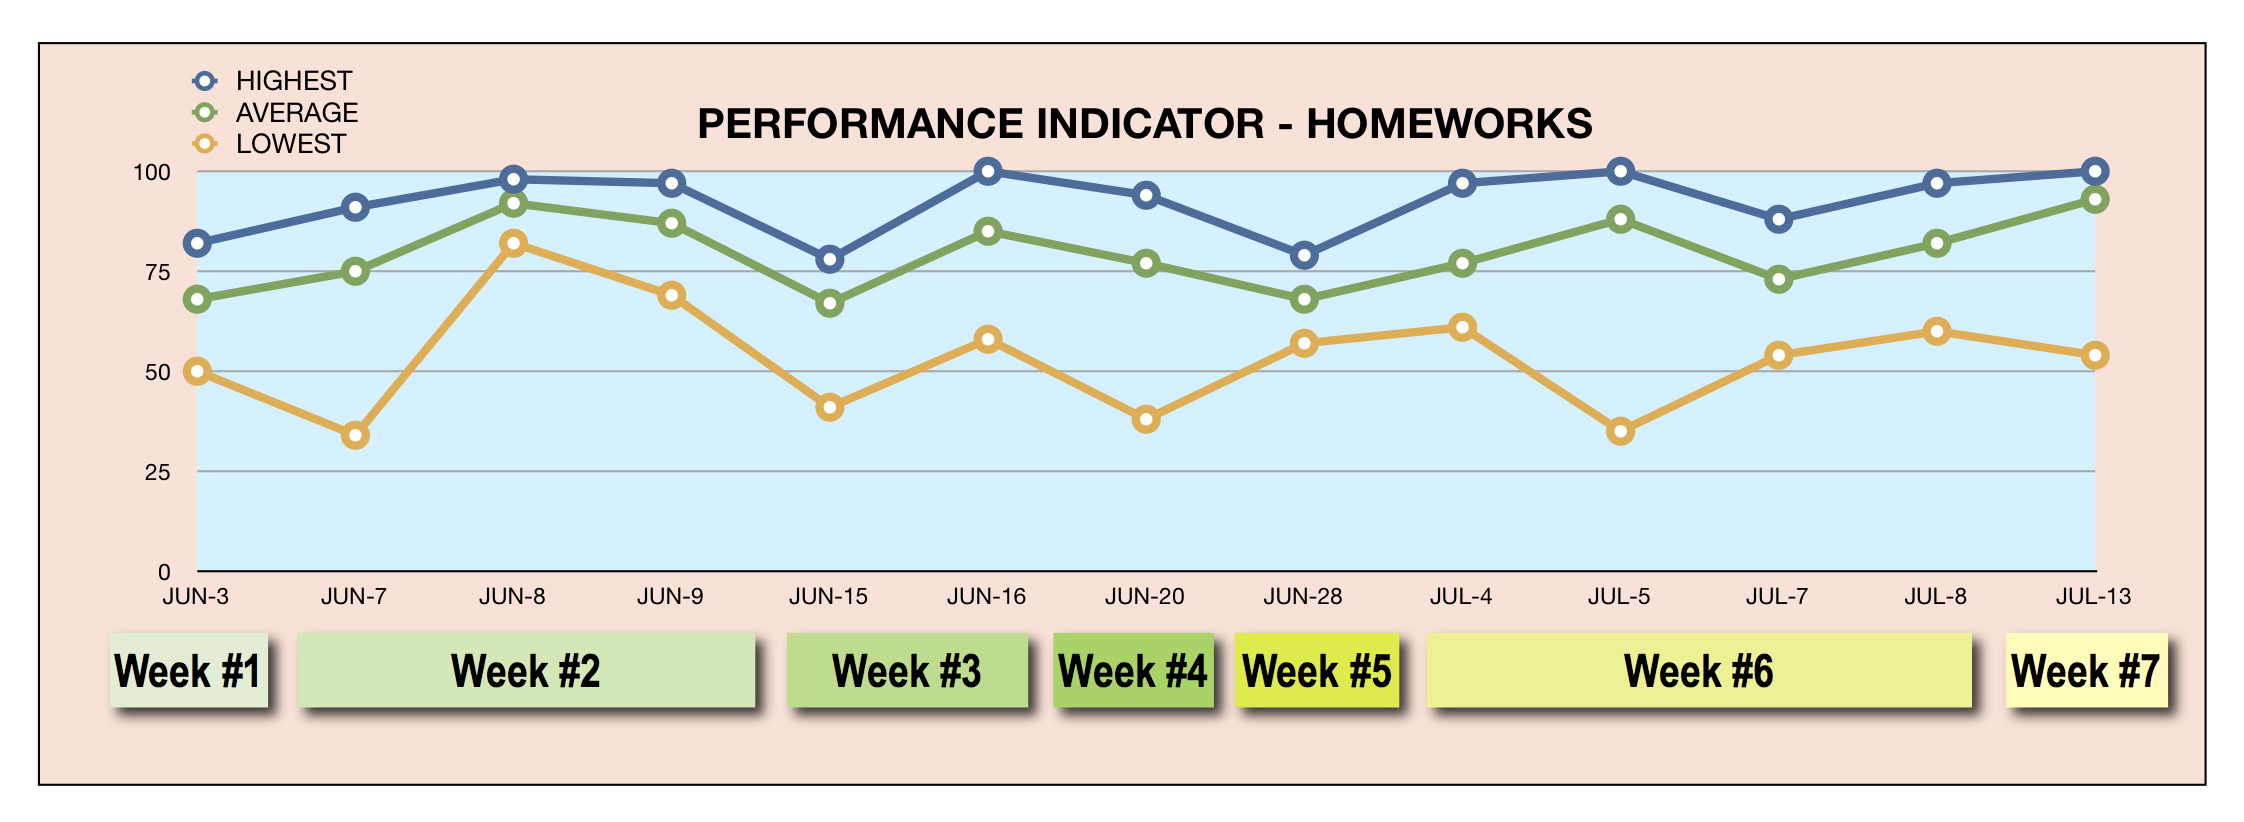
There was perfect ATTENDANCE during the 7th and fnal week. HOMEWORK generally went up during the same period. CLASS WORKS and QUIZZES also showed positive gains.


By the end of the Summer term, a total of 12 students (with grades of A, B, or C) were deemed successful.
| GRADE DISTRIBUTION AFTER WEEK #06 | ||||||
| A | B | C | D | F | W | TOTAL |
| 1 | 5 | 6 | 3 | 1 | 1 | 17 |
The chart below depicts the final grade distributions, after the final exams and comprehensive problem solving requirements were reocorded.
