Assessment / Summer 2011 > AC 131/1 - ACCOUNTING 1
PRETEST vs POSTTEST
These assessment data are for AC 131/1 - ACCOUNTING
1, Section 1 in Summer 2011. Twelve (12) of the twenty (20) registered
students took
the pretest on the first day of class.
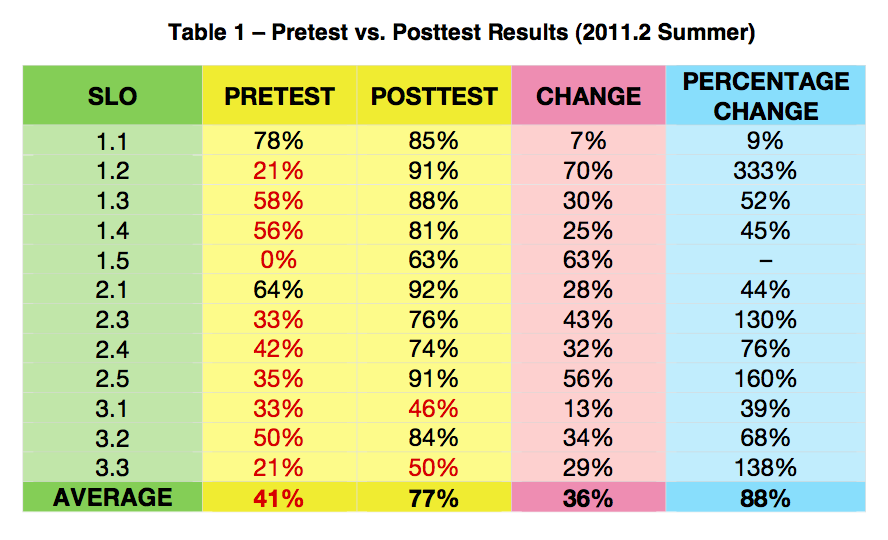
All 40 pretest questions were embedded in the Final Exam, which served as a posttest. Sixteen (16) students took this exam. All SLOs showed positive changes, with an average increase of 88% (See table below)
The results are summarized in Table 1 below.

An item analysis disclosed negative changes in the percentage of students with correct answers between pretest and posttest in five of the questions asked. As could be gleaned from the results, some questions were easy, some moderately easy (or moderately difficult) and some, challenging. It is not uncommon for some students to get the answer right in the first attempt by simply guessing, and then answer the same question incorrectly later on after the relevant topic had been discussed, suggesting a failure to achieve the intended outcome.
| ITEM ANALYSIS - PRETEST VS. POSTTEST RESULTS (2011.2 SUMMER) | |||||||
| SLO # | ITEM # | STUDENTS WITH CORRECT ANSWERS | PERCENTAGE CHANGE | ||||
| PRETEST (12 STUDENTS) | POSTTEST (16 STUDENTS) | ||||||
| 1.1 | 1 | 10 | 83% | 13 | 81% | (2%) | |
| 2 | 10 | 83% | 14 | 88% | 5% | ||
| 3 | 8 | 67% | 14 | 88% | 31% | ||
| 1.2 | 4 | 5 | 42% | 16 | 100% | 140% | |
| 5 | 0 | 0% | 13 | 81% | – | ||
| 1.3 | 6 | 5 | 42% | 13 | 81% | 95% | |
| 1.4 | 7 | 10 | 83% | 12 | 75% | (10%) | |
| 8 | 7 | 58% | 12 | 75% | 29% | ||
| 1.3 | 9 | 4 | 33% | 16 | 100% | 200% | |
| 10 | 12 | 100% | 14 | 88% | (13%) | ||
| 11 | 7 | 58% | 13 | 81% | 39% | ||
| 2.1 | 12 | 6 | 50% | 13 | 81% | 63% | |
| 13 | 8 | 67% | 16 | 100% | 50% | ||
| 14 | 9 | 75% | 15 | 94% | 25% | ||
| 2.3 | 15 | 3 | 25% | 9 | 56% | 125% | |
| 2.4 | 16 | 11 | 92% | 16 | 100% | 9% | |
| 1.5 | 17 | 0 | 0% | 10 | 63% | – | |
| 1.4 | 18 | 3 | 25% | 15 | 94% | 275% | |
| 2.3 | 19 | 4 | 33% | 14 | 88% | 163% | |
| 20 | 2 | 17% | 9 | 56% | 237% | ||
| 21 | 5 | 42% | 16 | 100% | 140% | ||
| 22 | 2 | 17% | 12 | 75% | 350% | ||
| 23 | 5 | 42% | 14 | 88% | 110% | ||
| 24 | 5 | 42% | 13 | 81% | 95% | ||
| 2.5 | 25 | 3 | 25% | 16 | 100% | 300% | |
| 26 | 4 | 33% | 15 | 94% | 181% | ||
| 27 | 5 | 42% | 15 | 94% | 125% | ||
| 28 | 5 | 42% | 12 | 75% | 80% | ||
| 3.1 | 29 | 7 | 58% | 15 | 94% | 61% | |
| 30 | 3 | 25% | 3 | 19% | (25%) | ||
| 31 | 2 | 17% | 4 | 25% | 50% | ||
| 3.2 | 32 | 4 | 33% | 13 | 81% | 144% | |
| 33 | 8 | 67% | 14 | 88% | 31% | ||
| 2.3 | 34 | 6 | 50% | 10 | 63% | 25% | |
| 2.4 | 35 | 2 | 17% | 9 | 56% | 237% | |
| 36 | 3 | 25% | 11 | 69% | 175% | ||
| 37 | 4 | 33% | 12 | 75% | 125% | ||
| 38 | 5 | 42% | 11 | 69% | 65% | ||
| 3.3 | 39 | 4 | 33% | 2 | 13% | (63%) | |
| 40 | 1 | 8% | 14 | 88% | 950% | ||
| AVERAGE | 5 | 43% | 12 | 78% | 81% | ||
TEST COVERAGE As mentioned earlier, there were 40 questions in the pretest. These questions, all in multiple choice format, were linked to the following student learning outcomes (SLOs).
|
|||||||
The pre-post assessed only the theoretical dimensions of selected student learning outcomes. SLOs not covered in the pre-post were assessed using homeworks, class works, and quizzes that involved solving accounting problems. There were some SLOs, however, that were assessed using a combination of both pre-post (accounting theory) and home or classroom activities (accounting problems). A weekly rundown of these assessment activities are discussed in the Weekly Assessment Data section.
