Assessment
"Price is what you pay. Value is what you get." ~
Warren Buffet
AC 131/2 - Accounting I (Section 2)
FALL SEMESTER 2017
- First Week of Instruction
(Week 1)
- Week 2 • Week 3 • Week 4 • Week 5 • Week 6 • Week 7 • Week 8 • Week 9 • Week 10 • Week 11 • Week 12 • Week 13 • Week 14 • Week 15 • Week 16
- Final Week (Week 17)
Performance Indicators – Whole Class
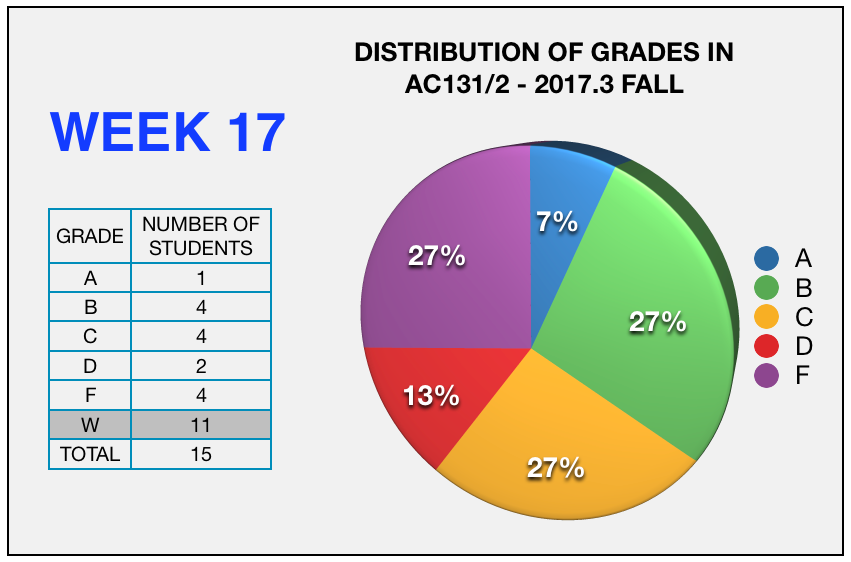
| DISTRIBUTION OF
GRADES (From Day 1 to Date) |
 |
| CLICK HERE
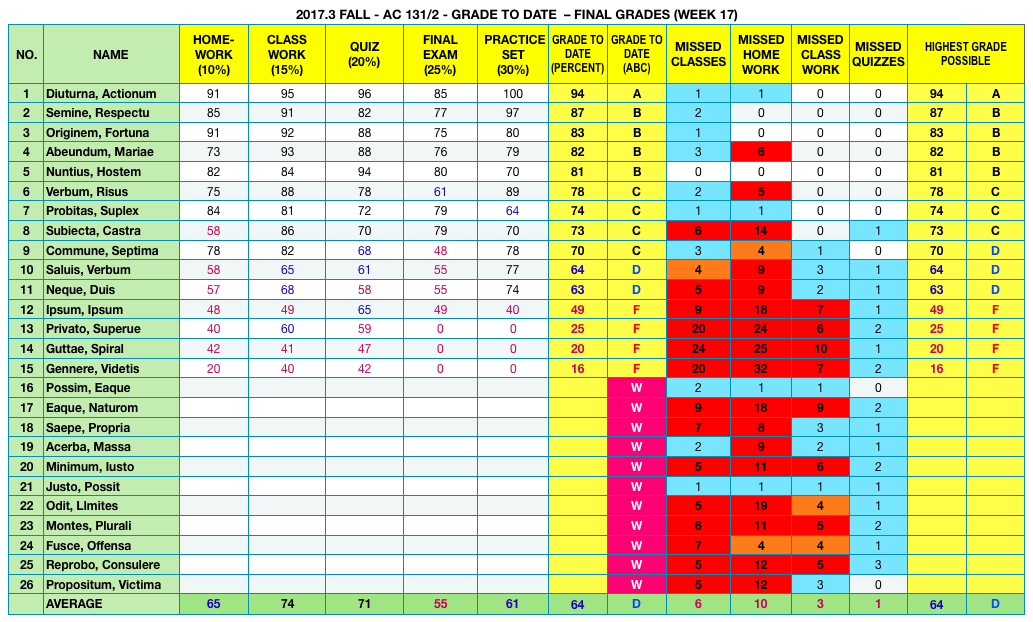
WEEK 17 for breakdown of grades by
students (sorted from higest to lowest). |
| RELATED INFORMATION |
Accounting 1- Section 2 (AC131/2) Class size: 15 Students (11 Withdrawn) Average Attendance Rate for past 17 weeks: 82% Grade components 45 homework; 20 class works; 7 quizzes; 1 exam; 1 individual project (Practice Set) |
Performance Indicators – Individual Students
| STUDENT PERFORMANCE – GRADES SORTED from Highest to Lowest (From Day 1 to Date) |
 |
Performance Indicator – Class Attendance
| STUDENT PERFORMANCE – Class Attendance (From Day 1 to Date) |
 |
Assessment of Course Learning Outcomes
| ASSESSMENT RESULTS BY STRATEGY – WRITTEN ASSIGNMENT (From Day 1 to Date) |
 |
| ASSESSMENT RESULTS BY STRATEGY – CLASSWORK (From Day 1 to Date) |
 |
| ASSESSMENT RESULTS BY STRATEGY – QUIZ (From Day 1 to Date) |
 |
| ASSESSMENT RESULTS BY
STRATEGY - EXAM (Final Examination with Embedded Posttest) |
 |
| ASSESSMENT RESULTS BY STRATEGY -
INDIVIDUAL PROJECT (Practice Set) |
 |
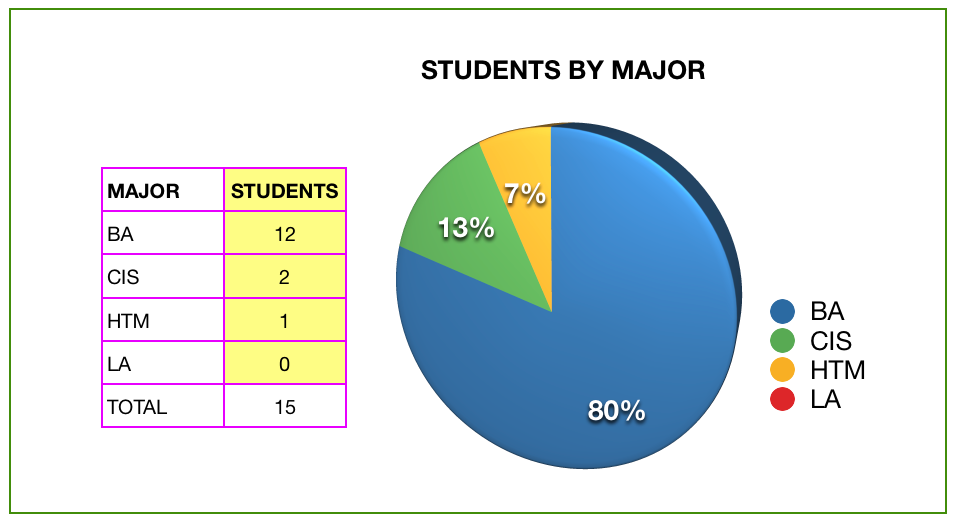
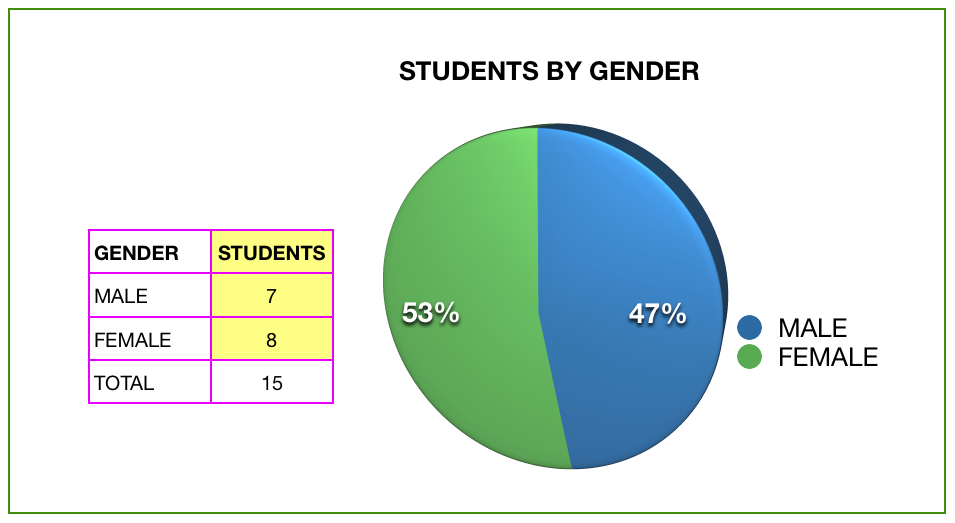
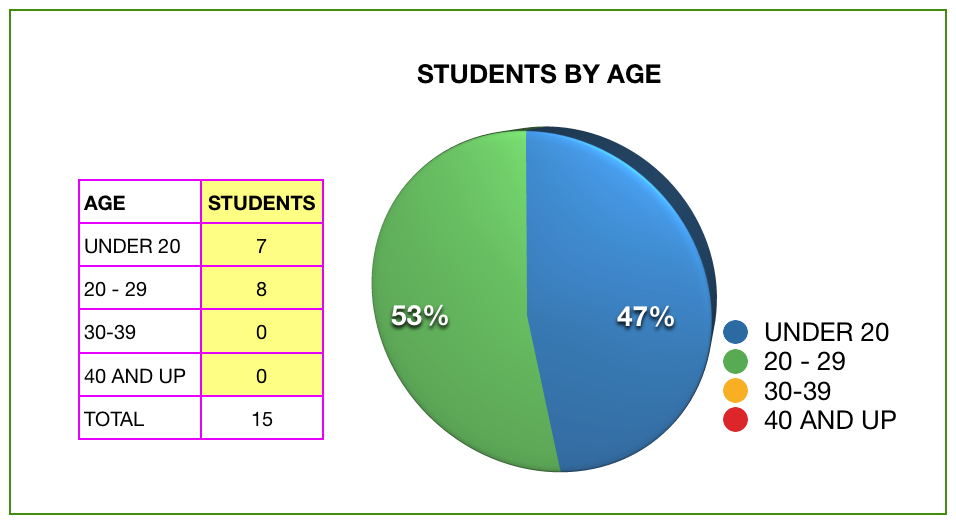
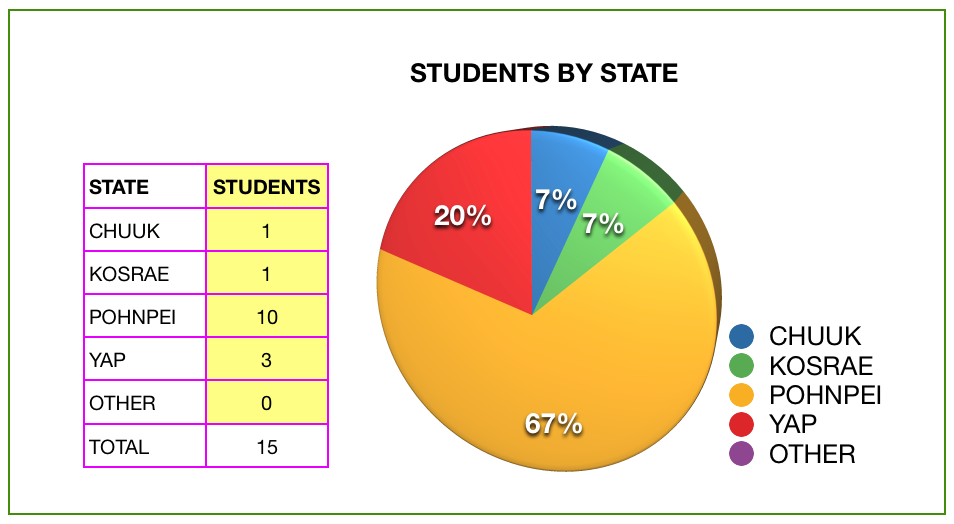
Student Demographics – Final Week
 |
 |
 |
 |
JUMP TO . . .
- First Week of Instruction
(Week 1)
- Week 2 • Week 3 • Week 4 • Week 5 • Week 6 • Week 7 • Week 8 • Week 9 • Week 10 • Week 11 • Week 12 • Week 13 • Week 14 • Week 15 • Week 16
- Final Week (Week 17)
This page does not reflect an official position of the College of Micronesia-FSM
© 2018 Rafael A. Pulmano. Design by Andreas Viklund | Modified by Jason Cole
